My Location: OH


Functions8th Grade |
|
|---|---|
Alabama Course of Study Standards: 13 |
|
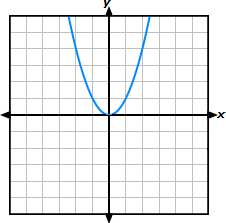
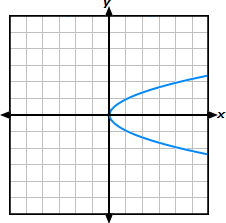
Determine whether a relation is a function, defining a function as a rule that assigns to each input (independent value) exactly one output (dependent value), and given a graph, table, mapping, or set of ordered pairs. |
|
Arizona Academic Standards: 8.F.1 |
|
Understand that a function is a rule that assigns to each input exactly one output. The graph of a function is the set of ordered pairs consisting of an input and the corresponding output. (Function notation is not required in Grade 8.) |
|
Common Core State Standards: Math.8.F.1 or 8.F.1Ohio's Learning Standards: 8.F.1 |
|
Understand that a function is a rule that assigns to each input exactly one output. The graph of a function is the set of ordered pairs consisting of an input and the corresponding output. Function notation is not required in Grade 8. |
|
Georgia Standards: 8.FGR.5.1 |
|
Show and explain that a function is a rule that assigns to each input exactly one output. |
|
Louisiana Academic Standards: 8.F.1 |
|
Understand that a function is a rule that assigns to each input exactly one output. The graph of a function is the set of ordered pairs consisting of an input and the corresponding output. (Function notation is not required in this grade level.) |
|
North Carolina - Standard Course of Study: 8.F.1 |
|
Understand that a function is a rule that assigns to each input exactly one output. |
|
New York State Next Generation Learning Standards: 8.F.1 |
|
Understand that a function is a rule that assigns to each input exactly one output. The graph of a function is the set of ordered pairs consisting of an input and the corresponding output. |
|
Tennessee Academic Standards: 8.F.1 |
|
Understand that a function is a rule that assigns to each input exactly one output. The graph of a function is the set of ordered pairs consisting of an input and the corresponding output. (Function notation is not required in 8th grade.) |
|
Wisconsin Academic Standards: 8.F.1 |
|
Understand that a function is a rule that assigns to each input exactly one output. The graph of a numerically valued function is the set of ordered pairs consisting of an input and the corresponding output. Function notation is not required in Grade 8. |
|
Alabama Course of Study Standards: 15 |
|
Compare properties of functions represented algebraically, graphically, numerically in tables, or by verbal
descriptions. |
|
Common Core State Standards: Math.8.F.2 or 8.F.2 |
|
Compare properties of two functions each represented in a different way (algebraically, graphically, numerically in tables, or by verbal descriptions). For example, given a linear function represented by a table of values and a linear function represented by an algebraic expression, determine which function has the greater rate of change. |
|
Georgia Standards: 8.FGR.5.4 |
|
Compare properties (rate of change and initial value) of two functions used to model an authentic situation each represented in a different way (algebraically, graphically, numerically in tables, or by verbal descriptions). |
|
North Carolina - Standard Course of Study: 8.F.2 |
|
Compare properties of two linear functions each represented in a different way (algebraically, graphically, numerically in tables, or by verbal descriptions). |
|
New York State Next Generation Learning Standards: 8.F.2 |
|
Compare properties of two functions each represented in a different way (algebraically, graphically, numerically in tables, or by verbal descriptions). |
|
Wisconsin Academic Standards: 8.F.2 |
|
Compare properties of two functions each represented in a different way (algebraically, graphically, numerically in tables, or by verbal descriptions). |
|
Alabama Course of Study Standards: 14 |
|
Evaluate functions defined by a rule or an equation, given values for the independent variable. |
|
Arizona Academic Standards: 8.F.3 |
|
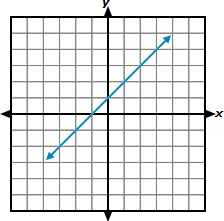
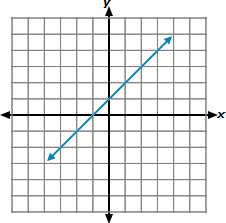
Interpret the equation y = mx + b as defining a linear function whose graph is a straight line; give examples of functions that are not linear. For example, the function A = s2 giving the area of a square as a function of its side length in not linear because its graph contains the points (1,1), (2,4), and (3,9) which are not on a straight line. |
|
Common Core State Standards: Math.8.F.3 or 8.F.3 |
|
Interpret the equation y = mx + b as defining a linear function, whose graph is a straight line; give examples of functions that are not linear. For example, the function A = s2 giving the area of a square as a function of its side length is not linear because its graph contains the points (1,1), (2,4) and (3,9), which are not on a straight line. |
|
Georgia Standards: 8.FGR.5.5 |
|
Write and explain the equations y = mx + b (slope-intercept form), Ax + By = C (standard form), and (y - y1) = m(x-x1) (point-slope form) as defining a linear function whose graph is a straight line to reveal and explain different properties of the function. |
|
North Carolina - Standard Course of Study: 8.F.3 |
|
Identify linear functions from tables, equations, and graphs. |
|
New York State Next Generation Learning Standards: 8.F.3 |
|
Interpret the equation y = mx + b as defining a linear function, whose graph is a straight line. Recognize examples of functions that are linear and non-linear. |
|
Wisconsin Academic Standards: 8.F.3 |
|
Interpret the equation y = mx + b as defining a linear function, whose graph is a straight line; give examples of functions that are not linear. |
|
Alabama Course of Study Standards: 17 |
|
Analyze the relationship (increasing or decreasing, linear or non-linear) between two quantities represented in a graph. |
|
Common Core State Standards: Math.8.F.5 or 8.F.5 |
|
Describe qualitatively the functional relationship between two quantities by analyzing a graph (e.g., where the function is increasing or decreasing, linear or nonlinear). Sketch a graph that exhibits the qualitative features of a function that has been described verbally. |
|
Georgia Standards: 8.FGR.5.9 |
|
Graph and analyze linear functions expressed in various algebraic forms and show key characteristics of the graph to describe applicable situations. |
|
North Carolina - Standard Course of Study: 8.F.5 |
|
Qualitatively analyze the functional relationship between two quantities. |
|
New York State Next Generation Learning Standards: 8.F.5 |
|
Describe qualitatively the functional relationship between two quantities by analyzing a graph. |
|
Pennsylvania Core Standards: CC.2.8.C.1 |
|
Define, evaluate, and compare functions. |
|
Pennsylvania Core Standards: M08.B-F.1.1 |
|
Determine whether a relation is a function. |
|
Pennsylvania Core Standards: M08.B-F.1.2 |
|
Compare properties of two functions, each represented in a different way (i.e., algebraically, graphically, numerically in tables, or by verbal descriptions). |
|
Pennsylvania Core Standards: M08.B-F.1.3 |
|
Interpret the equation y = mx + b as defining a linear function whose graph is a straight line; give examples of functions that are not linear. |
|
Pennsylvania Core Standards: M08.B-F.1.2 |
|
Describe qualitatively the functional relationship between two quantities by analyzing a graph (e.g., where the function is increasing or decreasing, linear or nonlinear). Sketch or determine a graph that exhibits the qualitative features of a function that has been described verbally. |
|
Florida - Benchmarks for Excellent Student Thinking: MA.8.1.1 |
|
Given a set of ordered pairs, a table, a graph or mapping diagram, determine whether the relationship is a function. Identify the domain and range of the relation. |
|
Florida - Benchmarks for Excellent Student Thinking: MA.8.1.2 |
|
Given a function defined by a graph or an equation, determine whether the function is a linear function.Given an input-output table, determine whether it could represent a linear function. |
|
Florida - Benchmarks for Excellent Student Thinking: MA.8.1.3 |
|
Analyze a real-world written description or graphical representation of a functional relationship between two quantities and identify where the function is increasing, decreasing or constant. |
|
Georgia Standards: 8.FGR.1 |
|
Show and explain that a function is a rule that assigns to each input exactly one output. |
|
Georgia Standards: 8.FGR.2 |
|
Within realistic situations, identify and describe examples of functions that are linear or nonlinear. Sketch a graph that exhibits the qualitative features of a function that has been described verbally. |
|
Georgia Standards: 8.FGR.3 |
|
Relate the domain of a linear function to its graph and where applicable to the quantitative relationship it describes. |
|
Georgia Standards: 8.FGR.4 |
|
Compare properties (rate of change and initial value) of two functions used to model an authentic situation each represented in a different way (algebraically, graphically, numerically in tables, or by verbal descriptions). |
|
Arkansas Academic Standards: 8.FN.3 |
|
Determine whether a relation is a function or not when given a function map, table, graph, equation, or set of ordered pairs. |
|
Arkansas Academic Standards: 8.FN.4 |
|
Compare the rate of change (slope) and y-intercept (initial value) of two linear functions each represented in different forms. |
|
Arkansas Academic Standards: 8.FN.5 |
|
Distinguish between linear and nonlinear functions by comparing graphs and equations. |
|
Arkansas Academic Standards: 8.FN.6 |
|
Determine the rate of change (slope) and y-intercept (initial value) from tables, graphs, equations, and verbal descriptions of linear relationships. |
|
Arkansas Academic Standards: 8.FN.7 |
|
Interpret and explain the meaning of the rate of change (slope) and y-intercept (initial value) of a linear relationship in a real-world context. |
|
Arkansas Academic Standards: 8.FN.8 |
|
Analyze a graph by describing the functional relationships between two quantities. |
|
Arkansas Academic Standards: 8.FN.9 |
|
Sketch a graph that exhibits qualitative features of a function described verbally. |
|
 8th Grade Math - Functions Lesson