Common Core State Standards:
Math.8.F.1 or 8.F.A.1
Understand that a function is a rule that assigns to each input exactly one output. The graph of a function is the set of ordered pairs consisting of an input and the corresponding output.
Common Core State Standards:
Math.8.F.2 or 8.F.A.2
Compare properties of two functions each represented in a different way (algebraically, graphically, numerically in tables, or by verbal descriptions). For example, given a linear function represented by a table of values and a linear function represented by an algebraic expression, determine which function has the greater rate of change.
Common Core State Standards:
Math.8.F.3 or 8.F.A.3
Interpret the equation y = mx + b as defining a linear function, whose graph is a straight line; give examples of functions that are not linear. For example, the function A = s2 giving the area of a square as a function of its side length is not linear because its graph contains the points (1,1), (2,4) and (3,9), which are not on a straight line.
Common Core State Standards:
Math.8.F.5 or 8.F.B.5
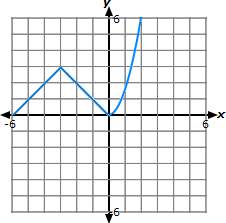
Describe qualitatively the functional relationship between two quantities by analyzing a graph (e.g., where the function is increasing or decreasing, linear or nonlinear). Sketch a graph that exhibits the qualitative features of a function that has been described verbally.
8th Grade Math - Functions Lesson
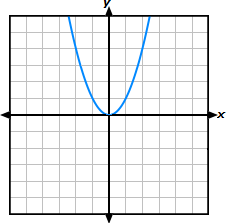
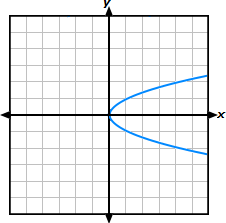
A function is a relationship between input values and output values wherein there is a unique output for each input.
If a function's input values are x-values and its output values are y-values, then y can be referred to as a function ofx.
Input
Output
-4
2
-3
-1
0
6
1
8
6
12
Input
Output
-4
-2
-3
-1
0
6
0
8
6
12
function
not a function
(-4, -8) (-2, 5) (0, 3) (2, -1) (4, -4)
(-4, 8) (-2, 5) (0, 3) (-2, -1) (-4, -4)
function
not a function
function
not a function
A linear function is a function which can be written in the form y = mx + b, where m is the slope and b is where the line crosses the y-axis.
The point where a line crosses the y-axis is called the y-intercept. At this point, the x-value is 0.
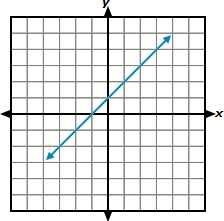
The table, graph, and equation each represent the same line. The y-intercept of the line is (0, 1).
x
y
-2
-1
-1
0
0
1
1
2
y = x + 1
The slope of a line is also called the rate of change. Given two points on a line, (x1, y1) and (x2, y2), the slope is the ratio of the change in y to the change in x.
In the equation above, y = x + 1, the slope is the coefficient on x, which is 1.
In the table above, choose any two points to find the slope. The calculation below shows finding the slope using the points (0, 1) and (1, 2).
In the graph above, choose any two points to find the slope. The calculation below shows finding the slope using the points (1, 2) and (2, 3).
A linear function is a function which can be written in the form y = mx + b. If a function cannot be written in this form, it is referred to as nonlinear.
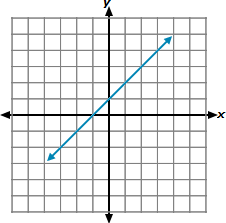
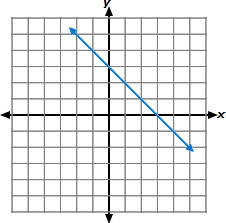
The graphs of linear functions are straight lines. The graphs of nonlinear functions are not straight lines.
linear
nonlinear
linear
linear
linear
nonlinear
A function is increasing if the output values increase as the input values increase.
A function is decreasing if the output values decrease as the input values increase.