Texas Essential Knowledge and Skills (TEKS):
6.12.A
represent numeric data graphically, including dot plots, stem-and-leaf plots, histograms, and box plots;
Texas Essential Knowledge and Skills (TEKS):
6.12.B
use the graphical representation of numeric data to describe the center, spread, and shape of the data distribution;
Texas Essential Knowledge and Skills (TEKS):
6.12.C
summarize numeric data with numerical summaries, including the mean and median (measures of center) and the range and interquartile range (IQR) (measures of spread), and use these summaries to describe the center, spread, and shape of the data distribution; and
Texas Essential Knowledge and Skills (TEKS):
6.12.D
summarize categorical data with numerical and graphical summaries, including the mode, the percent of values in each category (relative frequency table), and the percent bar graph, and use these summaries to describe the data distribution.
Texas Essential Knowledge and Skills (TEKS):
6.13.A
interpret numeric data summarized in dot plots, stem-and-leaf plots, histograms, and box plots; and
Texas Essential Knowledge and Skills (TEKS):
6.13.B
distinguish between situations that yield data with and without variability.
Florida - Benchmarks for Excellent Student Thinking:
MA.6.DP.1.1
Recognize and formulate a statistical question that would generate numerical data.
Florida - Benchmarks for Excellent Student Thinking:
MA.6.DP.1.2
Given a numerical data set within a real-world context, find and interpret mean, median, mode and range.
Florida - Benchmarks for Excellent Student Thinking:
MA.6.DP.1.3
Given a box plot within a real-world context, determine the minimum, the lower quartile, the median, the upper quartile and the maximum. Use this summary of the data to describe the spread and distribution of the data.
Florida - Benchmarks for Excellent Student Thinking:
MA.6.DP.1.4
Given a histogram or line plot within a real-world context, qualitatively describe and interpret the spread and distribution of the data, including any symmetry, skewness, gaps, clusters, outliers and the range.
Florida - Benchmarks for Excellent Student Thinking:
MA.6.DP.1.5
Create box plots and histograms to represent sets of numerical data within real-world contexts.
Florida - Benchmarks for Excellent Student Thinking:
MA.6.DP.1.6
Given a real-world scenario, determine and describe how changes in data values impact measures of center and variation.
6th Grade Math - Data Displays & Analysis Lesson
A statistical question is one where there is variability in the answers to the question.
Numeric data from a statistical question can be displayed in a line plot. A line plot is a data display, along a number line, which shows frequency. The frequency is represented with a marker, like an x or a dot.
Mean, median, and range can be used to analyze data in a line plot.
The mean, or average, of a data set is the sum of the values in the data set divided by the number of values in the data set.
The median is the middle value in an ordered data set.
The range is the difference between the greatest and least values in a data set.
Example:
First, find the sum of the values in the data set. There are thirteen 8-inch skillets, seven 9-inch skillets, ten 10-inch skillets, and ten 12-inch skillets.
13(8 in.) + 7(9 in.) + 10(10 in.) + 10(12 in.)
=
104 in. + 63 in. + 100 in. + 120 in.
=
387 in.
Then, divide the sum by the number of values shown in the graph, 40.
387 in. ÷ 40 = 9.675 in.
So, the mean diameter of the skillets is 9.675 inches.
A statistical question is one where there is variability in the answers to the question.
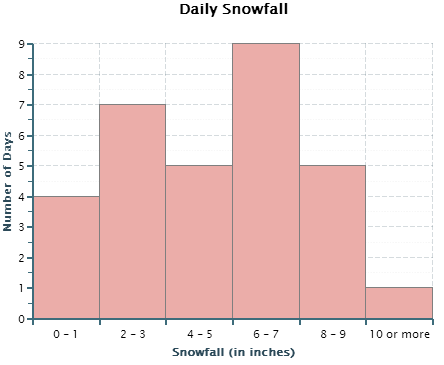
Numeric data from a statistical question can be displayed in a histogram. In a histogram, frequency is represented by the heights of the bars, and each bar corresponds to a range of values.
Example:
The table shows that it snowed 0 to 1 inch on 4 days, 2 to 3 inches on 7 days, 4 to 5 inches on 5 days, 6 to 7 inches on 9 days, 8 to 9 inches on 5 days, and 10 or more inches on 1 day.
So, in the correct graph, the bar above 0 - 1 ends at 4, the bar above 2 - 3 ends at 7, the bar above 4 - 5 ends at 5, the bar above 6 - 7 ends at 9, the bar above 8 - 9 ends at 5, and the bar above 10 or more ends at 1.
Median can be used to analyze data in a histogram. The median is the middle value in a data set.
In a histogram, the median is in the range that contains the middle value of the data set.
Example:
There are 31 values in the data set shown on the graph.
So, the median is the sixteenth value in the data set.
The first bar represents four values, the second bar represents seven values, and the third bar represents five values, so the sixteenth value is in the third bar.
So, the median snowfall is in the range 4 - 5 inches.
A statistical question is one where there is variability in the answers to the question.
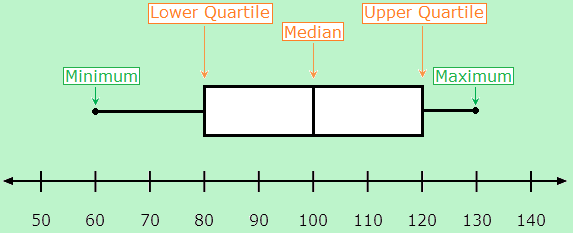
Numeric data from a statistical question can be displayed, based on its quartiles, in a box plot.
Minimum
The least value in a data set.
Maximum
The greatest value in a data set.
Median
The middle value in a data set.
Lower Quartile
The median of the bottom half of a data set.
Upper Quartile
The median of the top half of a data set.
Example:
First, find the minimum, maximum, lower quartile, upper quartile, and median of the data in the table.
3, min
5, 11,
14, lower quartile
15, 18, 19,
22, median
25, 28, 29,
31, upper quartile
42, 47,
55 max
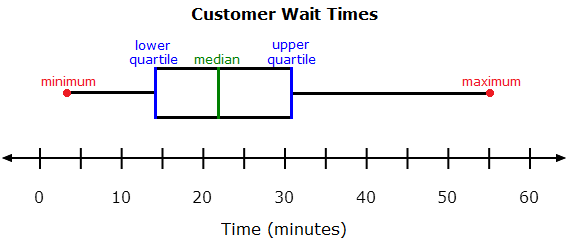
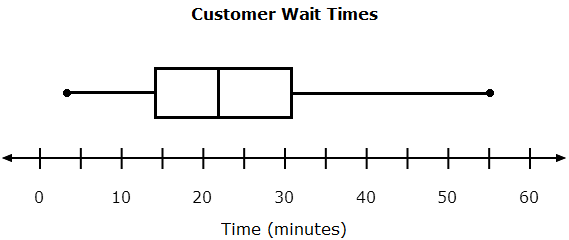
Then, use the values to make a box plot.
The finished box plot is shown below.
Interquartile Range
The interquartile range is the difference between the upper quartile and lower quartile.
Example:
The interquartile range is the difference between the upper quartile and lower quartile. In a box plot, the upper quartile is indicated by the right side of the box, and the lower quartile is indicated by the left side of the box.
In this case, the upper quartile is 31 minutes, and the lower quartile is 14 minutes. Find the difference between the upper quartile and the lower quartile.
31 min - 14 min = 17 min
So, the interquartile range of the wait times is 17 minutes.
A frequency table shows how often a certain piece of data appears in a data set.
Example:
Keeva has 7 blue buttons, 8 brown buttons, 1 red button, 2 purple buttons, and 3 gold buttons in the jar.
Make a table with the color in one column and the corresponding number of buttons in the other column.
Button Color
Number in Jar
Blue
7
Brown
8
Red
1
Purple
2
Gold
3
Example:
The mode is the item that occurs most often in a data set. The table shows that Keeva has 7 blue buttons, 8 brown buttons, 1 red button, 2 purple buttons, and 3 gold buttons.
There are more brown buttons in the jar than the other colors of buttons. So, the mode of the buttons is brown.
Example:
First, find the total number of buttons in the jar.
7 + 8 + 1 + 2 + 3 = 21
Next, divide the number of buttons of each color by the total number of buttons.
Button Color
Number in Jar
Blue
7 ÷ 21 ≈ 0.33
Brown
8 ÷ 21 ≈ 0.38
Red
1 ÷ 21 ≈ 0.05
Purple
2 ÷ 21 ≈ 0.1
Gold
3 ÷ 21 ≈ 0.14
Then, convert each decimal to a percent.
Button Color
Number in Jar
Blue
33%
Brown
38%
Red
5%
Purple
10%
Gold
14%
A stem-and-leaf plot is a two column data display which shows the frequency of values in a data set.
Typically, the last digit of the value is in the leaf column, and the preceding digits are shown in the same row in the stem column.
Example:
The stem-and-leaf plot represents values in the twenties, thirties, forties, fifties, and sixties.
The first row, with a 2 in the stem column, represents values in the twenties: 25, 27, 28, 28, and 29.
The second row, with a 3 in the stem column, represents values in the thirties: 30, 31, 33, 36, 37, and 37.
The third row, with a 4 in the stem column, represents values in the forties: 41, 42, 42, 43, and 44.
The fourth row, with a 5 in the stem column, represents values in the fifties: 52, 53, and 55.
The last row, with a 6 in the stem column, represents values in the sixties: 60 and 61.
Example:
The oldest teacher is 61. The youngest teacher is 25.
Find the difference.


 6th Grade Math - Data Displays & Analysis Lesson