My Location: OH


Linear Representations7th Grade |
|
|---|---|
Texas Essential Knowledge and Skills (TEKS): 7.7.a |
|
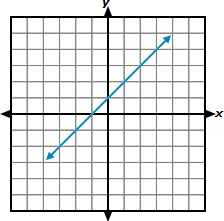
represent linear relationships using verbal descriptions, tables, graphs, and equations that simplify to the form y = mx + b. |
|
|
|
|
 7th Grade Math - Linear Representations Lesson